Architecture
Acceldata Torch is a data cataloging and data quality monitoring system. It crawls meta information from various sources and stores the information in a format useful for searching and finding relevant data locations. It helps you to add workflows that checks and compares the quality of data in a particular asset and across assets as well.
It consists of two user-level feature components.
- Metadata Store: Metadata store is a database of data fields that are common across your project.
- Quality Assurance: The quality assurance enables you to verify the quality of the data in the data store.
These two components are front-ended by a browser-based user interface, by which you can browse through various metadata of several data sources and then set up workflows to regularly monitor the health of the data.
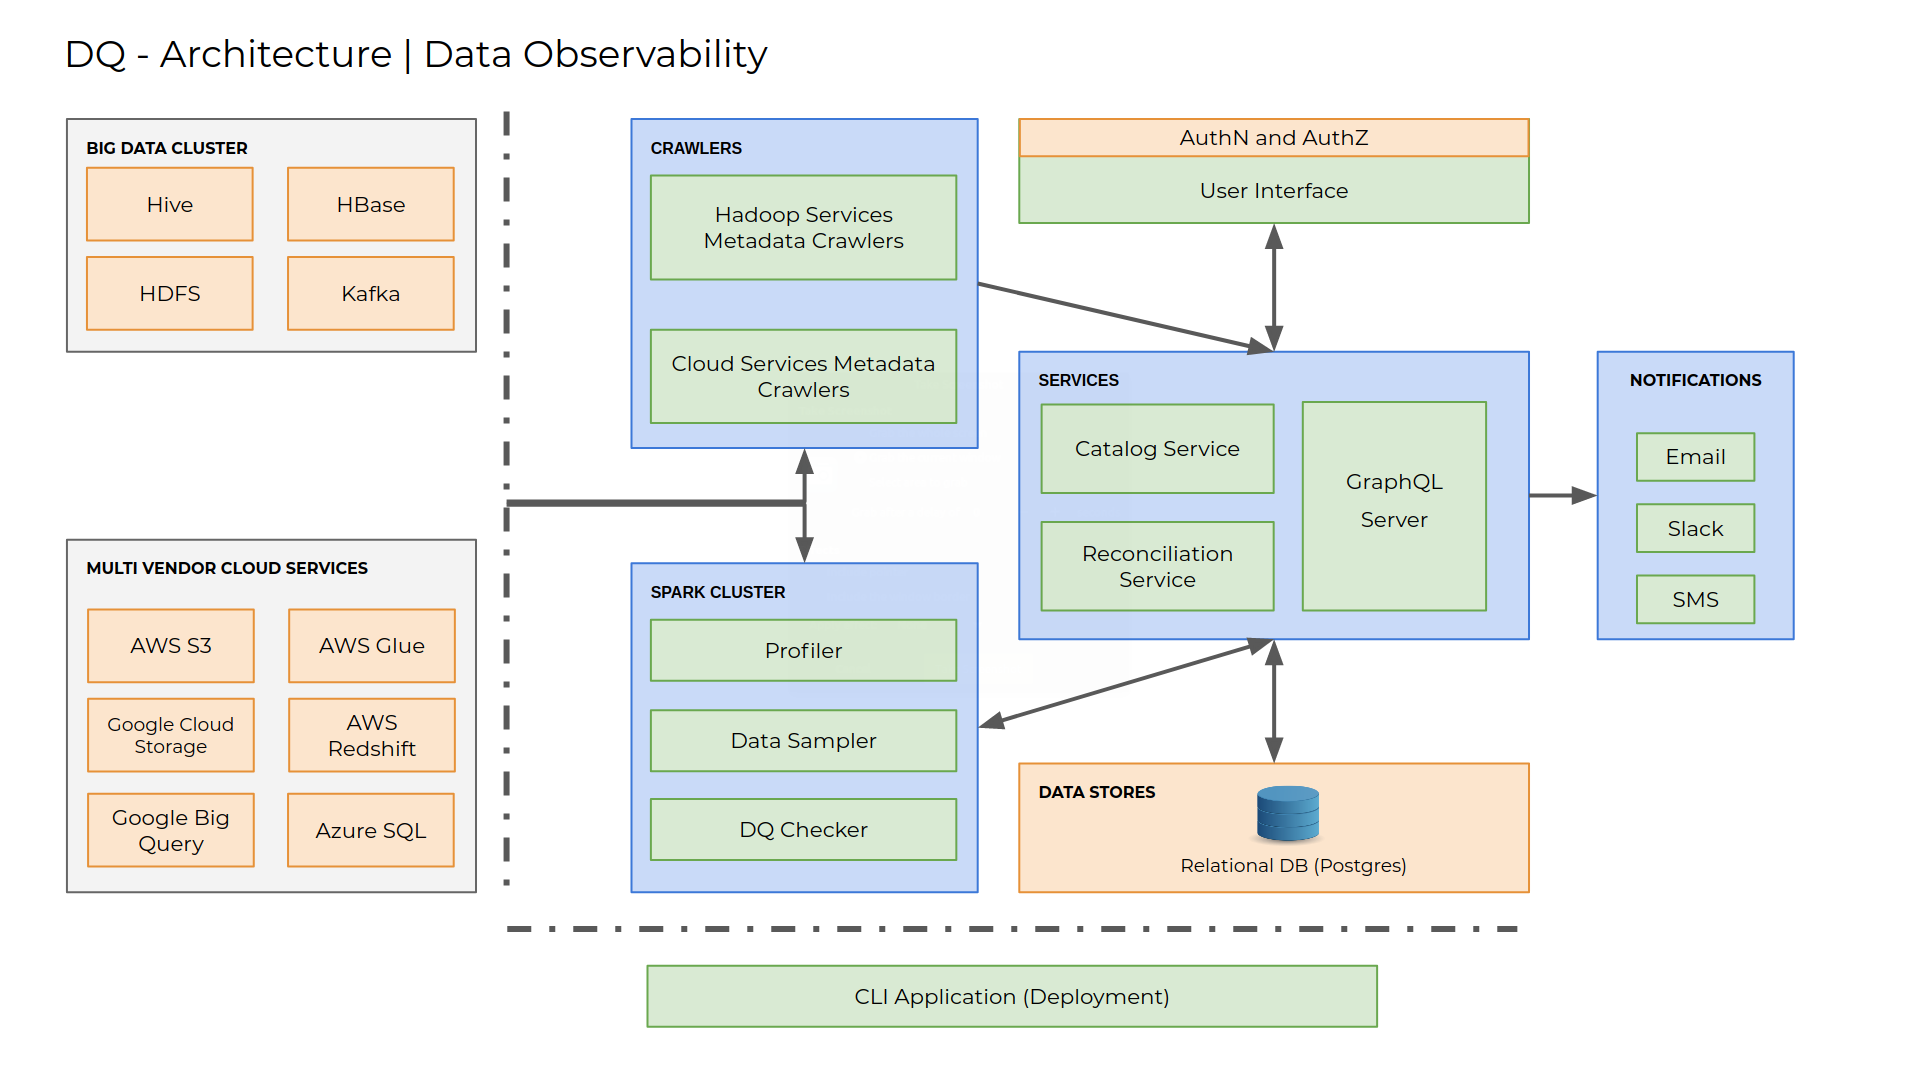
The below diagram identifies the functional blocks of Torch data catalog and the interactions between them.

5 steps to understand the working of Torch
- Create a connection to a data source using the UI.
- Create a data source definition and associate the data source to the connection.
- Deploy a crawler specifying the data source name. The crawler crawls the data source and retrieves the meta-information. Then it sends REST(Representational State transfer) calls to store the meta-information to the catalog server. Catalog server indexes them properly and stores it in a database. Here the metadata is categorized into assets and a hierarchical relationship is created between assets. You can repeat the above process to crawl other data sources or the same data source with different configurations (assembly).
- Use the UI to go over the meta-information and retrieve valuable data regarding the data stored in their data source. You may also look into the profile of the data and also see sample data stored. Catalog server calls Analytics service to retrieve this information. You can also auto-tag assets based on configurable regular expression patterns.
- Create a topology and representation of the ETL process. Each topology will contain nodes and edges. Each node is connected to a distinct asset. From each node or a combination of two nodes, you can configure data quality rules or a reconciliation rules.
These quality rules can be configured to run periodically or manually. Once a rule executes, it creates an execution in the system. There is an outcome of execution and that determines if the rule has passed or failed during that period. This will be displayed in the UI and a notification will be sent to the you by email or Slack messages.
Over a period of time, with the result of the execution, you will have an understanding of the quality of the data. If the execution fails once again, you can precisely figure out where the failure has happened in your pipeline.
This will help you to fix the issue in your system.