Asset Details
A data catalog is an inventory of data assets in an organization. To view the details of any data asset, navigate to the Discover page. Search for the asset with the help of search bar and filter options, and click the asset in the asset panel. The Asset Details page is displayed.
Types of Assets
Based on the type of asset selected, the details of the asset provided will vary.
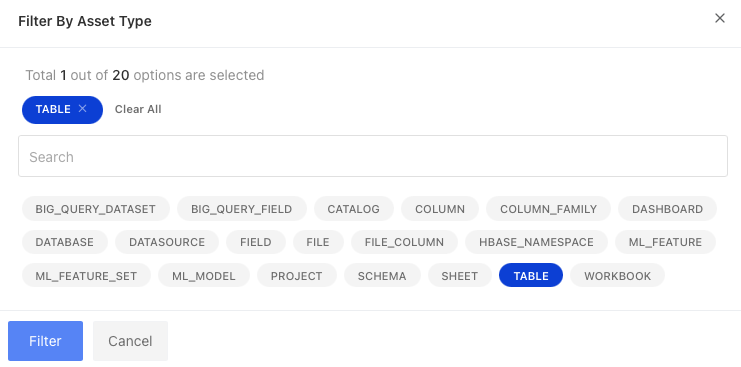
Below is a description of the details provided for the following asset types: Database and Table.
Database
You can view the following tabs:
Related Assets: The Related Assets tab displays all the tables belonging to the database.

Schema Changes: The Schema Changes tab displays a panel with all the snapshots that are taken every time a crawler runs. Select exactly two snapshots for comparison.
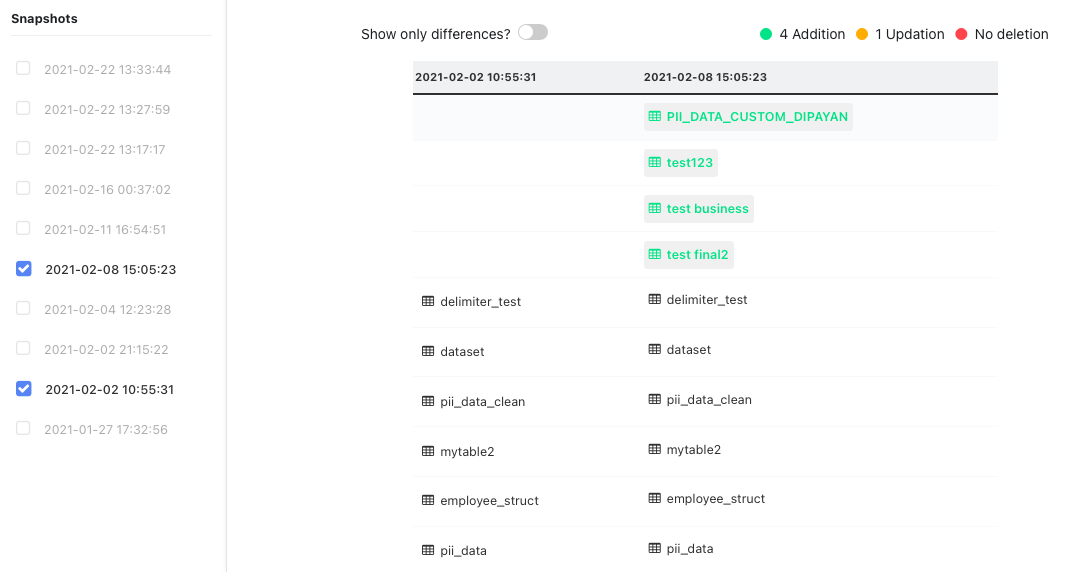
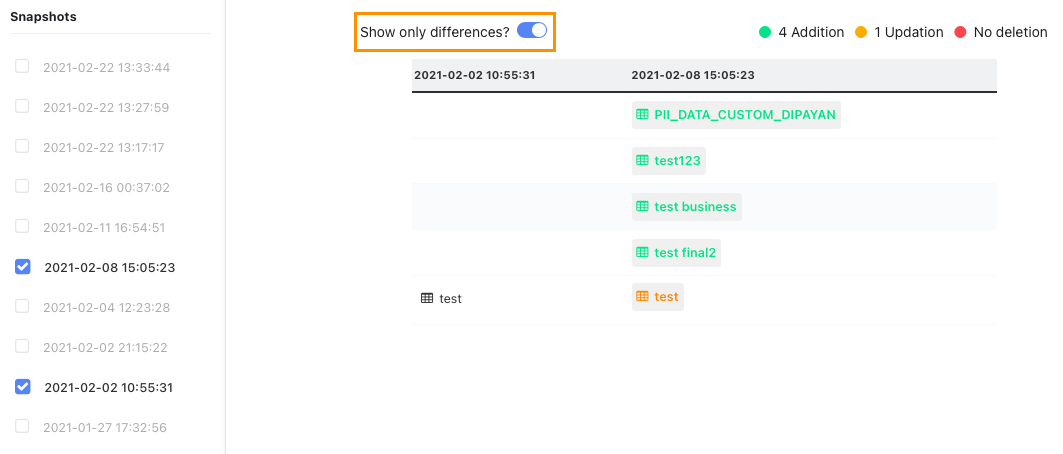
To show only the differences between the two executions, click the Show Only Differences toggle icon.
Overview: The Overview tab provides you with the description, metadata, and label info for the selected database.
- You can edit the description by clicking the edit icon.
- To add labels, click the plus icon and enter the required values.

Table
You can view the following tabs in the Asset Details page of a table:
Profile
Asset profiling helps to identify data quality issues in data sources. The profiling tab displays the below information about the assets profiled within the selected table.
Current Profile: Displays the following information about the profiled table for a selected date and time.
Property Name Definition Example Current Rows Profiled Number of rows profiled. 1001 Total Rows Profiled Total number of rows profiled 1500 Profiling Type Full or Sample type of asset profiling? Full or Sample Status Defines whether the asset was successfully, or unsuccessfully profiled. Successful, or Failed Start Time Defines the date and time at which the profiling of the asset started. 2020-06-11 14:15:00 End Time Defines the date and time at which the profiling had ended. 2020-06-11 14:15:17 Click the Profiled At button and select a date and time to view that days profile information for the selected table.
Compare Profiles: This tab allows you to compare the current profiled data of an asset with previously profiled data.
Profile Now
Click Profile Now and select Sample Profile or Full Profile from the drop-down list to profile the asset accordingly.
Schedule Profile
Click Schedule Profile from the drop-down list to schedule the profiling of an asset. The Profile Schedular wizard is displayed.
Select one of the following profiling types from the Profiling Type drop-down list.
Profiling Type Description Sample Profiles the first 100 columns in the table. Full Profiles all the columns in the table. Incremental Incremental profile uses a monotonically increasing date column to determine the bounds for selecting data from the data source Based on profiling type selected, specify values for the required properties. For Sample and Full profile select a schedule. For Incremental type, do the following:
- Select one of the following incremental strategies and specify required values accordingly.
- Auto Increment Id based
Incremental profile uses a monotonically increasing value of a column to determine the bounds for selecting data from the data source. - Partition based
Incremental profile uses a date based partition column to determine the bounds for selecting data from the data source. Only useful if the data source supports partition. - Incremental Strategy
Incremental profile uses a monotonically increasing date column to determine the bounds for selecting data from the data source.
- Auto Increment Id based
- Select a column name from Date Column List.
- Specify a date format.
- Click Advanced to use the following advanced fields: Time Zone and Minute Offset.
- Click the Round End Date checkbox and select a frequency.
- Select a time tag to incrementally run the profile schedule for the asset.
- Click the toggle button to enable the configuration.
- Click Save Schedule.
- Select one of the following incremental strategies and specify required values accordingly.
Quality
The Quality tab provides you with information on the quality of your data.
| Execution Details | Description |
|---|---|
| Start | Execution start time |
| End | Execution end time |
| Configured | Number of evaluations configured |
| Passed | Number of evaluations passed |
| Scanned | Number of evaluations scanned |
| Failed | Number of evaluations failed |
| Status | Status of execution i.e whether it failed or passed |
| Quality Score | Percentage value of the data quality |

Execution Summary : The Execution Summary panel provides you with an overall summary of the execution status.
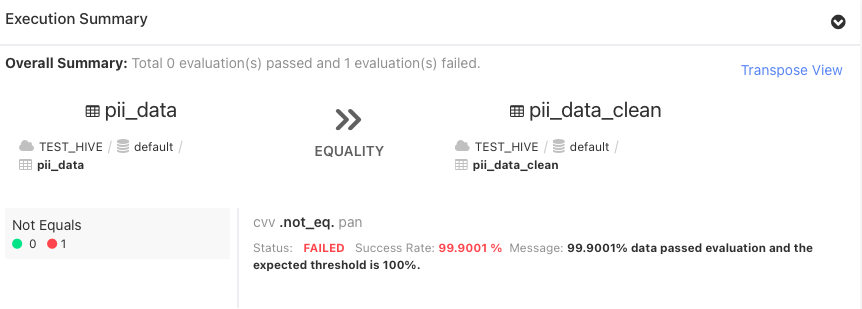
Data Violations: The Data Violations panel displays a sample of the data which attributed to the failure of the policy.
Sample Data
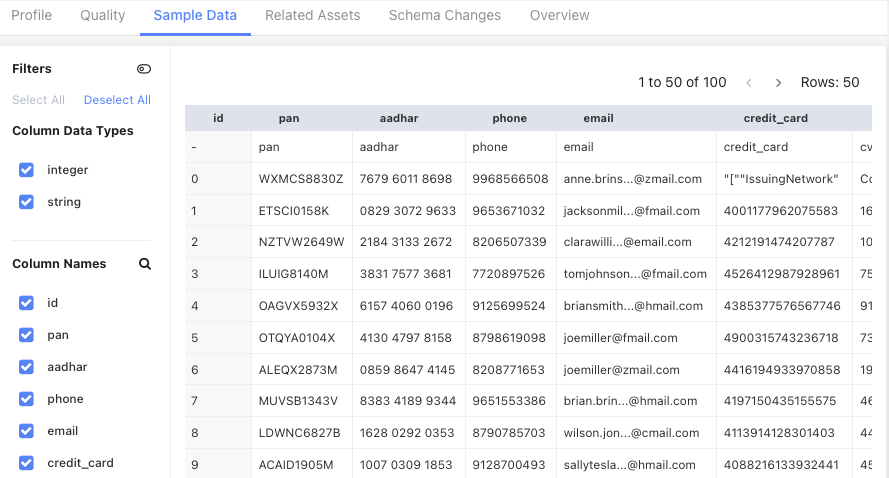
Click the Sample Data tab to view how the asset (table) would typically look like. You can filter the data according to the Column Data Type and Column Names. Click to minimize the filter panel.
Failed Policies
To view the details of a failed policy, click the Failed tab and click the policy name from the Policies panel. The following details are displayed in the Quality tab window:
| Property Name | Description |
|---|---|
| Name | Name of the failed policy |
| Description | Description that was provided while creating the policy. |
| Start Time | Policy execution start time |
| End Time | Policy execution end time |
| Status | Execution status whether failed or success |
| Failure Reason | Description for why the policy failed |

Click View Past Executions to view executions that have been executed in the past. The Data Quality/Executions page is displayed.
Successful Policies
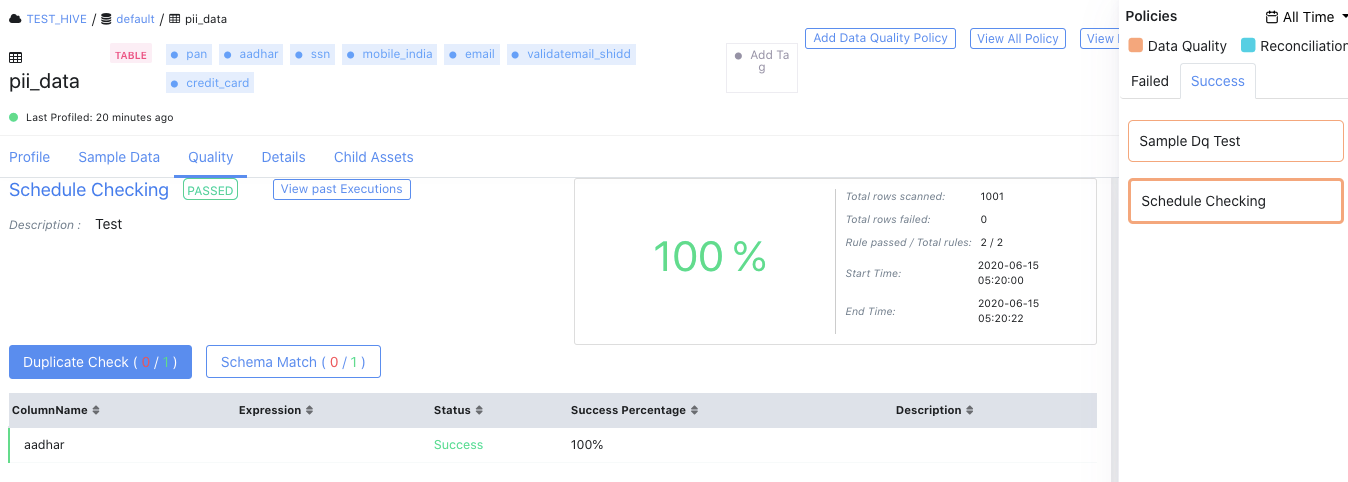
To view the details of a successful policy, click the Success tab and policy name from the Policies panel. The following details are displayed in the Quality tab window:
| Properties | Description |
|---|---|
| Name | Name of the policy. Click to go to the policy definition. |
| Status | Shows if the policy has succeeded or failed |
| Quality Score | Shows the data quality score of the underlying asset. |
| Description | Description about the policy |
| Total rows scanned | Sum of rows scanned during execution |
| Total rows failed | Sum of rows that did not scan during execution |
| Rule passed/ Total rules | Number of rules passed by the total number of rules |
| Start Time | Date and time at which the execution of the policy began |
| End Time | Date and time at which the execution of the policy ended |
You can also view the following details of the rules defined while creating the policy:
| Property Name | Description |
|---|---|
| Column Name | Name of the column that was selected while applying the rule definition |
| Expression | Expression value |
| Status | Success or failed |
| Success Percentage | Success percentage value |
| Description | Describes the total success percentage along with the expected threshold percentage if execution failed. |
Related Assets
All the columns that exist in the table are displayed in the Related Assets tab. Click the column tile to further view details and related assets that belong to the selected column.

Schema Changes
Schema Changes: The Schema Changes tab displays a panel with all the snapshots that are taken every time a crawler runs. Select exactly two snapshots for comparison.

To show only the differences between the two executions, click the Show Only Differences toggle icon.

Overview
The Overview tab provides you with the following information about the table:
- Descriptions: This is the description that was provided by you while creating the asset. If a description doesn't exist for the asset, click the Add button to add one.
- Metadata: Displays the meta data of the asset.
- Labels: Displays a table with the existing labels. You can edit the labels by clicking the edit icon. If there are no existing labels, you can add a label by clicking the plus icon.